-40%
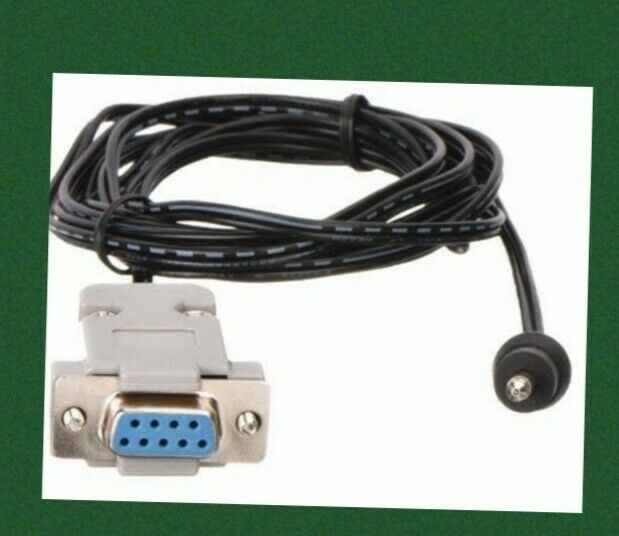
ACR Systems TR-EXP/NAUT-102 Interface Pkg with TrendReader 2 Express
$ 67.68
- Description
- Size Guide
Description
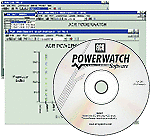
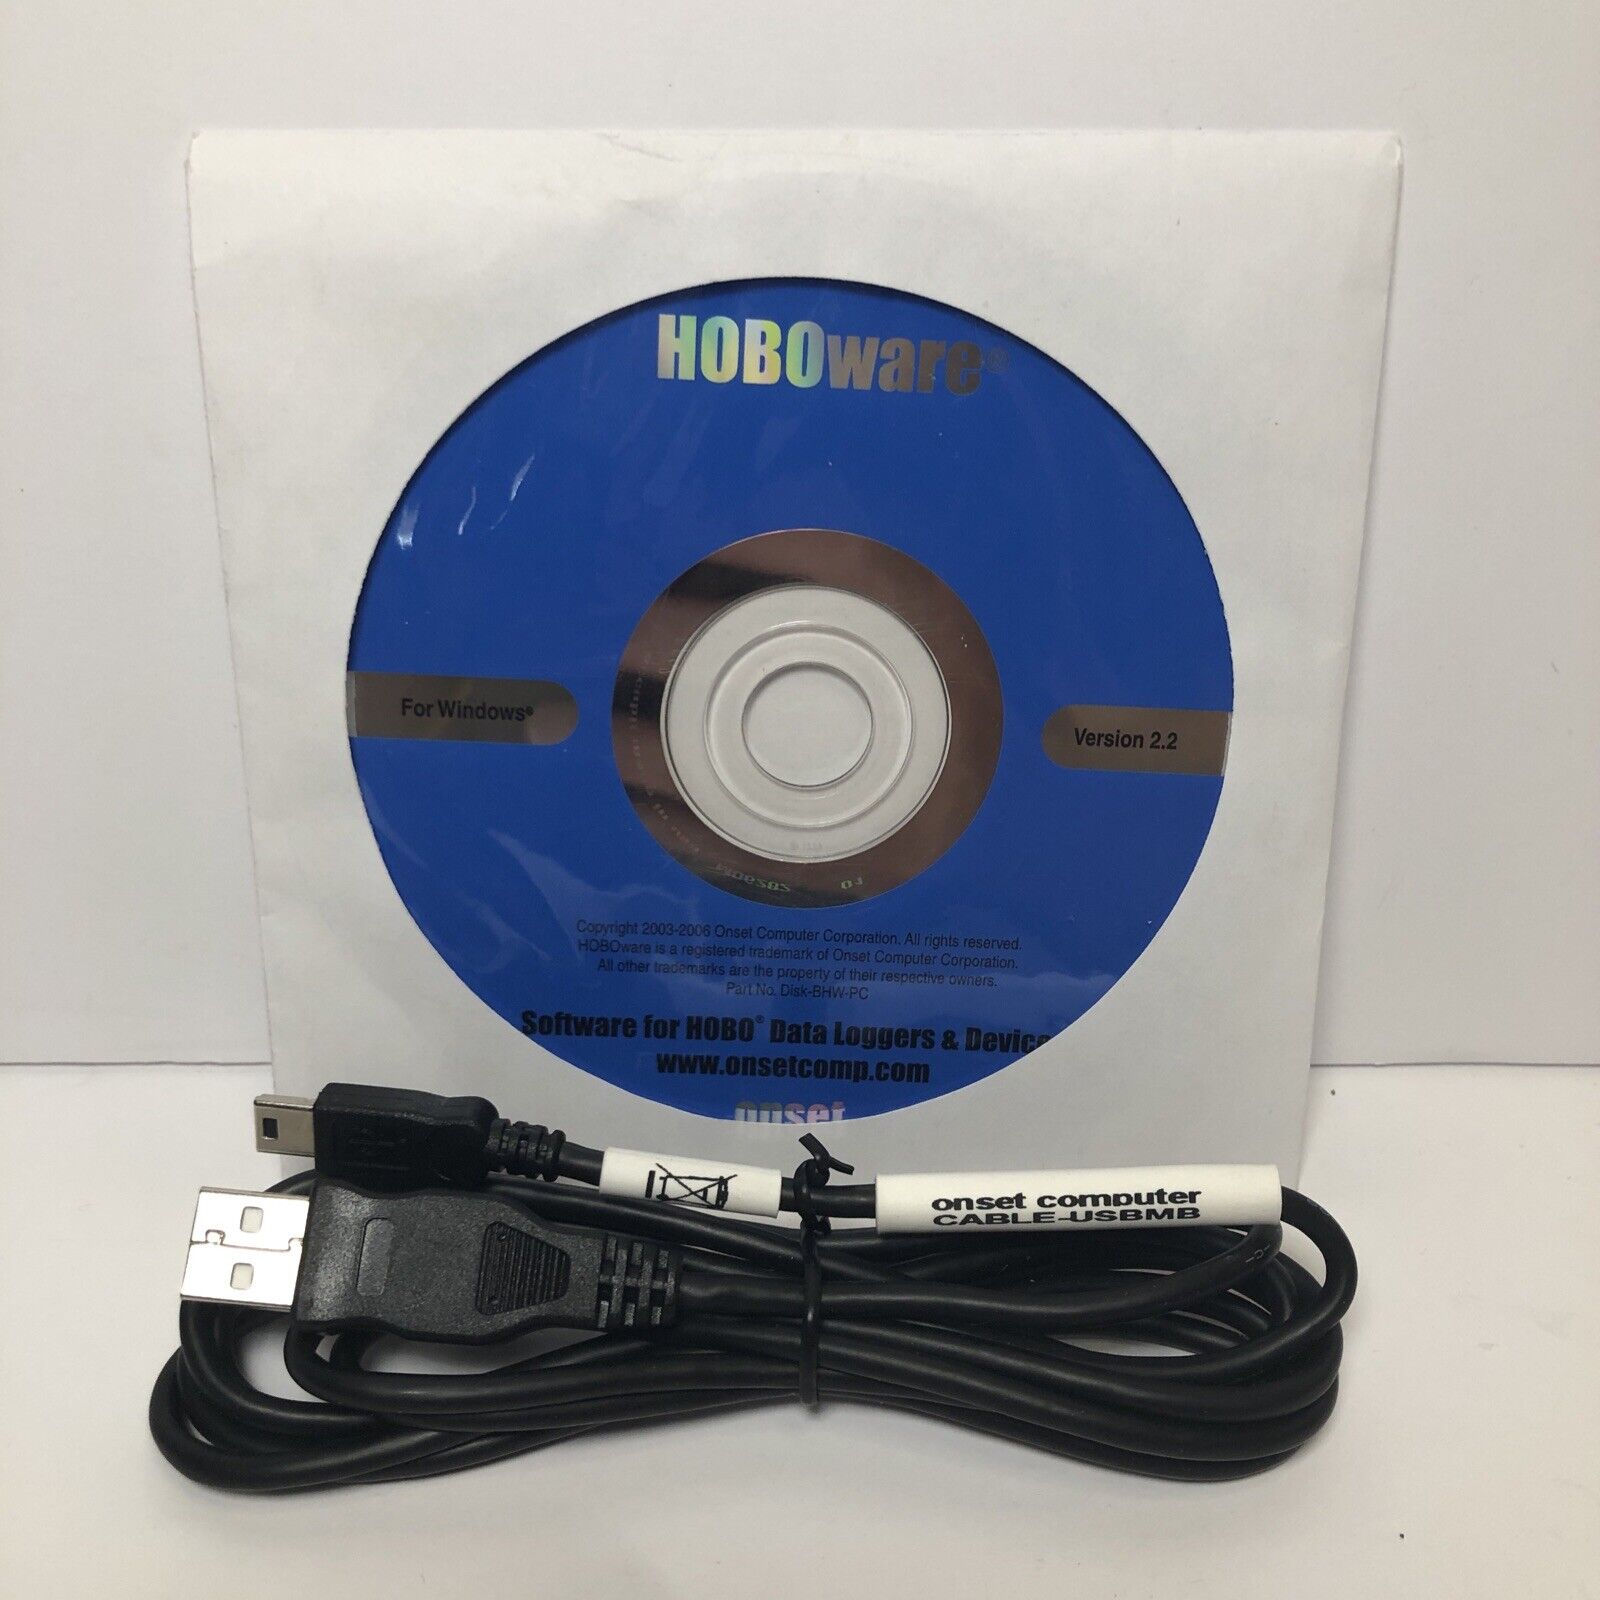
Subscribe to Our NewsletterACR Systems TR-EXP/NAUT-102 Interface Package with TrendReader 2 Express Software CD, USB Interface Cable, PDF Manual for Nautilus85/135 Data Loggers
Brand:
ACR Systems
Model No:
TR-EXP/NAUT-102
Ref No:
01-0274
Our Model No:
TREXPNAUT102
Product Overview
Features
TrendReader 2 Express software interface package with software CD, USB interface cable, and manual PDF
For use with Nautilus85 and Nautilus135 Data Loggers
Description
This powerful and easy-to-use power quality analysis software program is developed exclusively for ACR's voltage disturbance recorder, the PowerWatch. With no programming hassles or complex menus, setup and downloading occurs in seconds. Downloading and communicating with the PowerWatch could not be more simple: plug the optical interface cable into the serial port of your computer and point the other end to the optical port on the PowerWatch. Communication begins immediately. No tools, cards or docking stations are required. The following setup information is displayed in PowerWatch software: voltage disturbance threshold values, site descriptions, filename, start and stop data and time, and the recorder's serial number. Configure the threshold values for each voltage disturbance type or use the industry standard default values. A large number of events can be quickly analyzed by using the Quick Summary option. Quick Summary totals all the surge, sag and impulse events and displays all of their occurrences individually in a bar graph format. This format helps determine power quality trends quickly and effectively.The Event Distribution Graph plots the magnitude of events against duration on a logarithmic scale, allowing you to determine the importance of the data (a single random event may not be as important as a cluster of events). All 4000 events can be plotted on this graph. Graph hot-to-neutral or neutral-to-ground events or show both in different colors. The CBEMA Curve can be used to determine the importance of each event.
Terms & Conditions
Please note estimated delivery time above. Contact us for details or if you have a delivery requirement. We ask for your patience while striving to ensure your shipment arrives quickly and accurately.
Domestic Shipping
FREE Standard Shipping on items OVER and less than 30lbs to continental U.S. Add for AK, HI, or PR. Please contact us for shipping rates to any overseas US territories including: Northern Mariana Islands, Guam, Puerto Rico, U.S. Virgin Islands and American Samoa.
PO Boxes/APOs require USPS shipping and may therefore experience longer lead times
6.25% Sales Tax for shipping to MA
International Shipping
Due to international voltage requirements, please ask us prior to purchasing to confirm your product will operate correctly in your country.
Please contact us for shipping rates to any overseas U.S. territories.
International customers are responsible for all shipping charges, including any duties or taxes.
